Appreciation for software #6: lnav
Sometimes I find myself analyzing logs: the usual workflow is grepping my way through the file, often more files at once, sometimes both gzipped and uncompressed because I need to also look at old rotated logs. Then pipe and filter the results with sed, less, sort, uniq or cut whatever bash coreutils is needed to group stuff. Sometimes these bash oneliners get ugly. I hate Bash. I never bothered to learn awk because I hate it, too. Lots of hate, this workflow can be improved :-)
There are many command-line tools and online services (like Logentries) trying to solve this problem. I think I've found the sweet spot by using lnav. It's one of those tools that takes time to learn, but it pays off. Also, I love tools that make me feel I'm using only 10% of. I'm really thankful to the authors for having written such a tool.
A great feature I'm learning to use is to replace the old way of analyzing logs using a SQL syntax. lnav automatically creates a virtual SQlite table; the schema is based on the configuration file used to parse the logs. You can then use plain SQL queries (!) to tear logs apart and filter whatever you want.
Another powerful feature of lnav is its extensibility. Do you have a custom log file format? You can easily write a JSON file to teach lnav how to parse it in great detail. I was too lazy to write a script to generate that JSON so I've used this old perl script (btw, I don't like Perl, too).
Here's how: https://lnav.readthedocs.io/en/latest/formats.html#defining-a-new-format
Obviously, searching the web for "lnav log formats" shows that people had fun creating a lot of custom formats.
The documentation is really detailed, I always appreciate when a project is well documented.
Some usage examples:
- filter out stuff, add more filters one after another
- Run in headless mode, execute a SQL query and exit
$ lnav -n \
    -c ";SELECT c_ip, count(*), sum(sc_bytes) AS total FROM access_log \
        GROUP BY c_ip ORDER BY total DESC LIMIT 10"
    cloud-http-access.log

    c_ip      count(*) total
198.27.81.94          2   984
60.191.38.77          1   507
62.210.10.77          1   451
195.154.63.222        1   451
52.28.236.88          1   308
66.133.109.36         1   308
- Load live and rotated log files at the same time
$ lnav -r /var/www/logs/https-access.log

# will load:
    /var/www/logs/https-access.log
    /var/www/logs/https-access.log.1.gz
    /var/www/logs/https-access.log.2.gz
    /var/www/logs/https-access.log.3.gz
    ...
One funny situation in which lnav helped me is calculating how much time I've spent on a project. I had to look at the git history because I forgot to note down the time spent on the project. No, I'm too lazy to use time-tracking applications :-)
So, what I did is extracting my commits with a custom git log command (thanks Stack Overflow):
git log \
    --pretty=format:'%C(yellow)%h%x09%Creset%C(cyan)%C(bold)%ad%Creset  %C(green)%Creset %s' \
    --date=short \
    --reverse \
    --author=me
the result is something like this (I don't have colours on my shell, but you probably do ^_^):
9bda78ba2       2019-08-02   Lorem ipsum dolor sit amet
54fbd2cc5       2019-08-02   consectetur adipiscing elit, sed do
3e515d1ed       2019-08-02   eiusmod tempor incididunt ut labore
7f0e86e5b       2019-08-03   et dolore magna aliqua. Ut enim ad minim veniam
ef65b99c1       2019-08-05   quis nostrud exercitation ullamco
d55f249d8       2019-08-05   laboris nisi ut aliquip ex ea commodo
5c3bb1010       2019-08-06   consequat. Duis aute irure dolor in reprehenderit
3a2118cec       2019-08-06   in voluptate velit esse cillum dolore
...
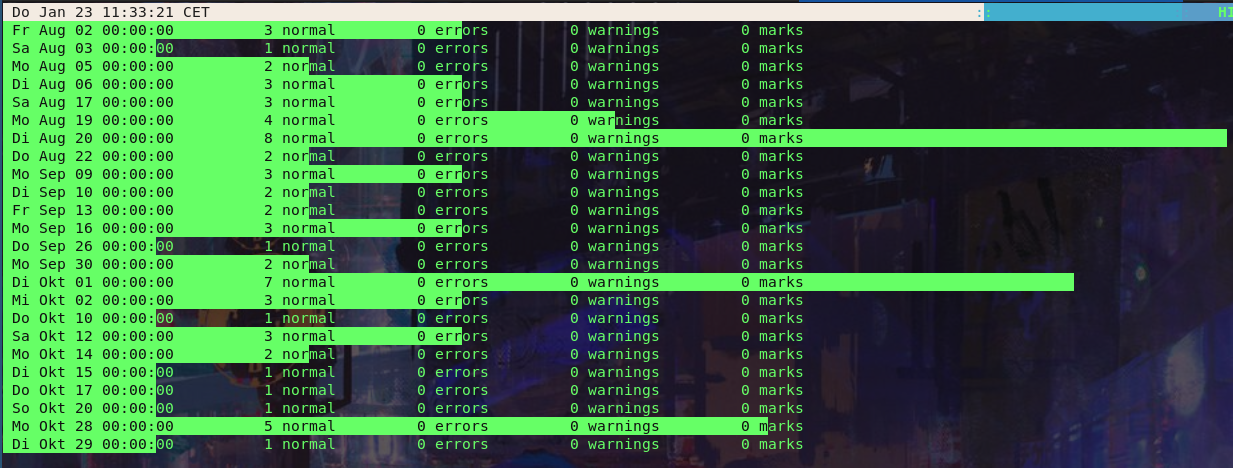
I then simply passed this to lnav, pressed i to see an histogram grouped by date, then pressed z/Z to zoom in/out to get to see the actual days. Example of the output:

It took me two days to write this invoice, but I've learned a lot in the process :-D
One final note: as of January 2020 the latest v0.8.5 release does not work under Wayland. I had to checkout the v0.8.6 alpha branch and compile it.


